
How Do You Know If B2B Research Is Working? A Teardown of 5 Companies

Updated: Jul 15
Table of Contents
Muck Rack’s State of Journalism 2026 report gets an estimated two monthly organic visits, which would make it easy to dismiss on a standard content dashboard.
But the same page has 61 backlinks from 48 referring domains, and its findings show up in industry coverage, PR trade sites, and LinkedIn posts from professionals using the data to make arguments of their own.
That gap is the problem with how B2B teams measure research. Research can shape a sales conversation, anchor a LinkedIn argument, support a pitch deck, or surface in an AI answer without sending anyone to the original URL. It can also collect traffic or links without giving the market anything specific enough to cite, reuse, or remember. Downloads and form fills capture some of this value, but only the company can see them. From the outside, performance is harder to judge because the value of research often appears in other people’s arguments.
For this reason, I studied five B2B companies — Muck Rack, Ashby, Attest, Customer.io, and AppFollow — to understand how to tell whether research is working. The assets included reports, benchmarks, indexes, trend studies and research hubs, scored across originality, reference value, discoverability, distribution and commercial usefulness.
The results showed that research performance is not captured by one metric. Traffic, citations, social reuse, answer-engine recall, and commercial usefulness each reveal a different part of the asset’s influence.
Methodology
I chose these five companies because each publishes recurring flagship research and together they show different levels of category competition.
AppFollow operates in a narrower category with fewer dedicated benchmark publishers. Muck Rack, Attest, Ashby, and Customer.io compete against more established research sources: Edelman and Cision in PR, McKinsey and NielsenIQ in consumer insights, LinkedIn and SHRM in talent, HubSpot and Braze in lifecycle marketing. This made it easier to compare whether research performance was shaped mainly by the quality of the asset or by the density of the category. This is not a representative sample of B2B research programs.
For each company, I used Ahrefs Site Explorer to review backlinks, referring domains, organic keywords, estimated traffic, and AI Overview appearances for the core research assets. This showed what the research was earning at the page level.
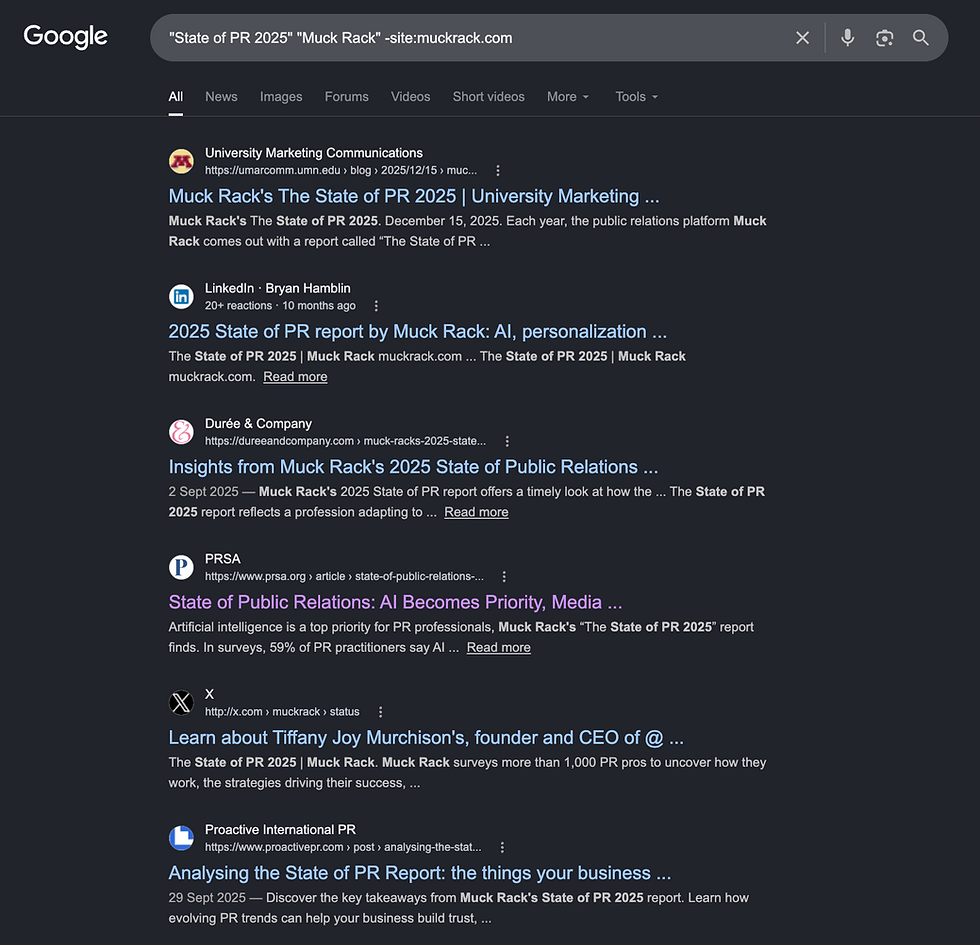
To measure reference value, I searched each flagship report by name while excluding the company’s own domain, such as "The State of Journalism 2026" -site:muckrack.com. This surfaced the third-party layer around each asset: media coverage, newsletter citations, LinkedIn commentary, and other sources using the data in their own arguments.
To assess distribution, I looked for LinkedIn posts from people with no stated affiliation to the company. Branded reposts showed owned distribution; unaffiliated posts showed whether the market found the research useful enough to carry.
For answer-engine recall, I ran one broad prompt across ChatGPT, Gemini, Perplexity, and Claude on 29 June 2026, asking for useful research across PR/media relations, consumer insights, lifecycle messaging, app reputation, and talent acquisition without naming any of the five companies. I treated this as directional because results vary by model, prompt, retrieval context, and date.
The main limitation is, every signal was measured from outside the company. I could not see downloads, form fills, influenced pipeline, sales usage, or closed-won impact. A report with modest external signals may still be performing commercially inside the company.
This analysis is also point-in-time. Gated reports can look weaker in Ahrefs because less content is indexed, and LLM recall is unstable. The scorecard compares relative strengths and gaps; it is not a statistical ranking.
How to Measure B2B Research: The Scorecard
Before the teardown, here is the scoring framework.
Each company was scored out of 25 across five dimensions:
Originality — how hard the data or methodology is to replicate. A 5 is proprietary or large-scale data a competitor couldn't reproduce without the same platform or years of collection; a 1 is a repackaging of numbers anyone could pull.
Reference value — whether third parties treat the research as source material. A 5 means media, publications, and independent writers cite it in their arguments; a 1 means it isn't cited outside the company's channels.
Discoverability — whether the asset surfaces when the category is searched, in both Google and answer engines. A 5 means it appears for broad category queries without the brand being named; a 1 means it's invisible unless you already know it exists.
Distribution — whether the idea travels beyond owned channels. A 5 means operators, consultants, and newsletters carry the findings unprompted; a 1 means distribution depends entirely on the brand pushing it.
Commercial usefulness — whether the research makes the product's value easier to explain or more urgent. A 5 means the findings map directly onto the problem the product solves; a 1 means the research and the product story run on separate tracks.

Muck Rack: When Research Becomes Category Evidence — 24/25
The Research
Muck Rack’s research portfolio works because it sits close to both sides of media relations: the PR teams trying to earn coverage and the journalists deciding what gets attention.
The State of Journalism, State of PR, and Local Journalist Index are built from journalist surveys, PR industry studies, and large-scale media analysis. That mix gives Muck Rack an advantage many PR software companies would struggle to copy: access to the people, behaviors, and datasets that shape the category.
Every report strengthens Muck Rack’s case for better journalist intelligence, sharper pitching, media monitoring, and PR measurement.
The Evidence
The State of Journalism 2026 is the clearest proof point. It is built from surveys of more than 1,000 journalists, which gives it a stronger evidentiary base than the average PR trend piece. What matters is where its influence shows up.
At the page level, the report looks unremarkable: two organic keywords, an estimated two monthly organic visits. If traffic were the only signal, you would underrate it. But the same Ahrefs view shows 61 backlinks from 48 referring domains, including Substack, Digiday, and PRNewswire — the places PR people, comms leaders, and journalists actually encounter industry arguments. That gap between two visits and 48 referring domains is the entire thesis of this piece in a single screenshot.

The exclusion search confirms the spread. Searching "The State of Journalism 2026" without Muck Rack's own domain returns third-party coverage from GlobeNewswire, PR Daily, Tomorrow's Publisher, and individual LinkedIn posts, most of them using the report's findings on AI adoption and pitching behavior to explain what is changing in media relations.

The LinkedIn evidence shows practitioners turning the data into arguments of their own. Merritt Group cited the findings that 54% of journalists seldom or never respond to pitches, 69% prefer pitches under 200 words, and 78% want them before noon — not as a repost, but as the backbone of their own point about earned media. That is the difference between content a company publishes and content a market uses.

The pattern repeats across the portfolio. State of PR 2025 has a thin URL-level footprint but visible third-party pickup across PR trade sites including PRSA and University Marketing Communications.

The Local Journalist Index — which analyzed 4.2 million articles and found local journalistic capacity has declined 81% since 2002 — shows zero ranking keywords in Ahrefs yet appears in journalism and academic conversations from Nieman Lab to the Benton Institute.


This is why Muck Rack leads the scorecard. Several of its research assets travel further through citations, Google results, LinkedIn posts, and industry coverage than through organic traffic to the original URLs. The research works because it gives the PR and journalism market evidence it can reuse.
Muck Rack Score Breakdown — 24/25
Originality: 5/5 — Surveys of journalists and PR teams, plus the Local Journalist Index’s 4.2M-article analysis, give Muck Rack a research base competitors cannot easily recreate.
Reference Value: 5/5 — The research is cited across PR, journalism, local news, university, and industry sources, including PR Daily, PRSA, Nieman Lab, GlobeNewswire, and other third-party sites.
Discoverability: 4/5 — Individual report pages have uneven organic performance, but Muck Rack appears in broad PR discovery paths such as “state of PR report.”
Distribution: 5/5 — PR and comms professionals use Muck Rack’s data to build arguments of their own, including posts from Merritt Group and other unaffiliated voices.
Commercial Usefulness: 5/5 — The research maps directly to the problems Muck Rack sells into: media relations, pitching, journalist preferences, PR measurement, and earned media strategy.
Total: 24/25
Tip for You
Do not judge research only by traffic to the report page. Track whether the market is using the research as evidence. Look for signals like:
Third-party articles citing your findings
LinkedIn posts using your data to make an argument
Newsletters referencing your stats
Sales teams using the findings in decks and calls
Category searches where your research appears without the brand being named
Industry conversations where your data becomes shorthand for the problem
Ashby: When Product Data Becomes Buyer Proof — 20/25
The Research
Ashby’s Talent Trends Report turns hiring activity into benchmarks recruiting teams can use.
Built from data on roughly 250,000 hires, the report shows how application volume, interview load, recruiter capacity, and offer outcomes are changing. Its strength comes from observed hiring behavior at scale, which is much harder to reproduce than a survey of recruiter opinions.
That makes the research commercially useful for Ashby. It gives hiring teams proof that recruiting is becoming harder to manage with fragmented systems, which supports the case for better recruiting operations software.
The Evidence
The Talent Trends Report has stronger page-level authority than most research assets in this study. In Ahrefs, the page shows 13.3K backlinks from 319 referring domains, 27 organic keywords, and an estimated 140 monthly organic visits. It also has some AI-adjacent visibility through AIO search queries and Grok.

The reference-value signal is also clear. An exclusion search for “Ashby Talent Trends Report” shows independent sites using Ashby’s data to support their own arguments. Pin cites the 250,000-hire analysis in a discussion about inbound and outbound recruiting. Onehour uses Ashby’s 31 million applications figure in a piece on candidate shortlisting statistics. Jobstrack references the dataset to argue that job postings now receive an average of 340 applications, while Re cites Ashby’s offer acceptance benchmarks directly.

The strongest distribution signal comes from LinkedIn, where talent professionals are using the report to frame their own arguments. Joe Shanbaum, a talent consultant with no Ashby affiliation, posted a detailed breakdown of the 2025 report — hires per recruiter stabilised at 5.4 per quarter, applications per hire rose 182% from 2021 to Q3 2024, and recruiting teams interviewed 40% more candidates per hire in 2024. His note, “I have no association with Ashby. I found the data interesting and wanted to share,” makes the signal harder to dismiss.

Cliff Sweet’s post adds a second signal. He shared Ashby’s Recruiter Productivity report by framing it around how recruiter productivity is measured as hiring evolves. That shows the research moving into a practical talent acquisition conversation, not just circulating as a branded content asset.

The constraint is broad category discovery. Searches for “hiring trends report” and “talent trends” return sources such as LinkedIn, the World Economic Forum, Indeed, SHRM, Mercer, and Randstad in the visible results captured. Ashby does not appear strongly in those default discovery paths.

That is why Ashby scores well without leading the scorecard. The research has page authority, third-party references, and credible LinkedIn distribution among talent professionals. The gap is broader category ownership: Ashby is useful once found, but larger workforce and analyst brands still dominate the most general discovery paths.
Ashby Score Breakdown — 20/25
Originality: 4/5 — The Talent Trends Report uses behavioral data from roughly 250,000 hires, which gives it more weight than a standard survey.
Reference Value: 4/5 — Third-party sources use Ashby’s data to discuss recruiting pressure, application volume, inbound/outbound hiring, and offer acceptance.
Discoverability: 3/5 — The Talent Trends page has URL-level authority, but Ashby does not appear strongly in broad searches such as “hiring trends report” or “talent trends.”
Distribution: 4/5 — Joe Shanbaum’s unaffiliated breakdown is a strong signal that talent leaders find the data useful enough to carry into their networks.
Commercial Usefulness: 5/5 — The findings map directly to Ashby’s product story: recruiter capacity, application volume, interview load, offer acceptance, and hiring team efficiency.
Total: 20/25
Tip for You
If your product generates usage data — transactions, workflows, response times, activity patterns, approvals, reviews, or any other behavior your platform records — you may have the raw material for a benchmark competitors cannot easily reproduce.
Start by finding the metric your customers already care about. It should meet three tests: your product captures it consistently, customers use it to judge performance, and the trend reveals a business problem worth solving.
Then turn that metric into a recurring benchmark.
Attest: Strong Research in a Crowded Category — 17/25
The Research
For Attest, research is a product demonstration.
Its Consumer Trends reports, housed in the wider Attest research hub, use recurring survey data to track shifts in spending, trust, sentiment, media behavior, AI adoption, and category attitudes. The reports are defensible because they are structured around the questions brand, marketing, and product teams already need to answer.
That connects cleanly to what Attest sells: a faster way to test messaging, validate assumptions, understand audience shifts, and make consumer-backed decisions.
The Evidence
Attest has reference value. An exclusion search for "Attest consumer trends report" returns third-party references from Quirks Media, Clicky, and Kadence, several pulling specific findings into their own analysis. Quirks cited the finding that 25% of Americans name mental health as a top concern for 2026; Clicky cited Attest's data that half of UK consumers describe their spending as cautious and 72% are likely to switch to cheaper brands.

The distribution signal holds up. Georgia McDonnell-Adams, Founder of Satori Inc, shared Attest's Gen Z Media Consumption 2025 data to make her argument about how Gen Z demands authenticity from brands.

The research hub shows the split in Attest’s performance. The /our-research hub, which houses its Consumer Trends reports and wider research library, has 1.2K backlinks from 430 referring domains at DR 74. That is real citation authority. But the same page pulls only 54 monthly organic visits from 11 keywords, with one AI Overview appearance and zero ChatGPT, Gemini, or Perplexity responses.

So the research is earning links, but it is not earning equivalent search demand or answer-engine recall. Reference value and discoverability are moving in different directions on the same asset.
The category context explains why. Searches for “best consumer insights reports” return an AI Overview led by McKinsey, NielsenIQ, Statista, and Bain. Searches for “consumer trends research report” surface larger consulting, market research, and analyst brands such as McKinsey, Euromonitor, Qualtrics, and Gartner. Attest does not appear strongly in those default discovery paths.


That is the tension in Attest’s score. The research is credible, commercially relevant, and cited for specific findings, but the consumer insights category is crowded with older and larger institutions.
Attest Score Breakdown — 17/25
Originality: 4/5 — The Consumer Trends reports are built from recurring consumer survey data, including the 2025 US report’s survey of 2,000 consumers aged 18–67.
Reference Value: 4/5 — Attest earns third-party references from sources such as Quirks, Clicky, Kadence, and LinkedIn posts using its consumer and Gen Z findings.
Discoverability: 2/5 — Broad consumer insights searches are dominated by larger research, consulting, and analyst brands such as McKinsey, NIQ/NielsenIQ, Statista, Bain, Euromonitor, Gartner, and Qualtrics.
Distribution: 3/5 — Attest has some unaffiliated social and third-party pickup, but the distribution signal is thinner than the strongest examples in the study.
Commercial Usefulness: 4/5 — The reports translate findings into decisions around messaging, channel strategy, audience prioritisation, spending pressure, and campaign planning.
Total: 17/25
Tip for You
If you publish research in a crowded category, useful findings are not enough. You need to make the decision path obvious.
For every major finding, answer three questions:
What changed?
Why should the buyer care?
What should the buyer test, adjust, or validate next?
Then connect the finding to a specific product use case. If consumers are switching to cheaper brands, show how a team can test price sensitivity. If Gen Z is changing where they discover products, show how a brand can validate channel preference. If trust is falling, show what messaging or claims a team should test before launching a campaign.
That is how research moves from “interesting consumer insight” to a practical reason to use your product.
Customer.io: Useful Data, Weaker Category Ownership — 16/25
The Research
Customer.io uses the State of Messaging Report to turn lifecycle marketing complexity into a market narrative.
The report covers email, push, in-app messaging, personalization, automation, experimentation, and first-party data. Its value comes from pulling these themes into one view of how messaging teams are trying to manage more channels, more data, and more customer journey complexity.
Since Customer.io sells the infrastructure for orchestration, automation, personalization, and customer data activation, the report gives the company a way to frame those needs as category-wide pressures.
The Evidence
At the report-page level, the State of Messaging Report has reference value but no organic performance. The URL shows 89 backlinks from 20 referring domains, but zero organic keywords, zero traffic, and no AI Overview or ChatGPT responses.

That makes the report stronger than a purely owned-channel asset, but weaker than a research page that earns search visibility on its own.
The third-party pickup supports the reference-value case. Exclusion searches return references from Marketing Brew, Business of Apps, Retention.Blog, WeDoCRM, Automate The Journey, and others using the report to discuss multi-channel messaging, personalization, and journey automation.

These references show the report has useful material. The findings are being used in conversations about how messaging teams manage complexity across channels, data, and customer journeys.
The gap appears at the category level. A search for “lifecycle marketing benchmark report” does not surface Customer.io in the visible results captured; the results are led by sources such as Airship, MOBI Solutions, and Klaviyo. A search for “customer messaging benchmarks” returns Infobip, Postscript, Emarsys, and MoEngage, with Customer.io absent from the visible results.

That is the core issue. The report earns references when people search for the report or encounter it through related content, but Customer.io is not showing up strongly when buyers search the broader category problem.
The second issue is distinctiveness. The report’s commercial logic is clear: better messaging requires better data, better personalization, better automation, and better orchestration. That is relevant to Customer.io’s product, but it is also a conclusion most lifecycle marketing platforms could agree with. The research would become sharper if it showed what teams misunderstand about messaging performance, which tactics are overvalued, or what high-performing lifecycle teams do differently.
That is why Customer.io lands at 16/25. The report is credible, product-relevant, and cited by third parties, but it does not yet have the category visibility or point-of-view sharpness of the strongest research assets in the study.
Customer.io Score Breakdown — 16/25
Originality: 4/5 — The State of Messaging Report uses credible platform and survey data across messaging channels, automation, experimentation, and first-party data.
Reference Value: 3/5 — The report earns citations from sources such as Marketing Brew, Business of Apps, WeDoCRM, and Automate The Journey, but it is not treated as a default source for lifecycle messaging benchmarks.
Discoverability: 2/5 — The report page shows zero organic keywords and zero estimated organic traffic, and Customer.io does not appear in the visible results captured for “lifecycle marketing benchmark report” or “customer messaging benchmarks.”
Distribution: 3/5 — Customer.io distributes the report through owned channels, with some third-party pickup, but less unaffiliated reuse than Muck Rack, Ashby, or AppFollow.
Commercial Usefulness: 4/5 — The findings connect clearly to Customer.io’s product: multi-channel messaging, automation complexity, experimentation, and customer journey orchestration.
Total: 16/25
Tip for You
Before publishing a report, define the argument you want the research to prove. Then pressure-test it with one question: could every serious competitor agree with this conclusion?
If the answer is yes, sharpen the angle.
AppFollow: Strong Dataset, Weak Market Carry — 15/25
The Research
AppFollow has the clearest data moat in the study.
Its 2026 Gaming App Reputation Benchmarks draws on 51.5 million reviews across 22,800 gaming apps on the App Store and Google Play, alongside more than 561,000 developer replies. The benchmark surfaced a 19-point sentiment gap between the two stores, a rating lift for developers who reply to reviews, and the fact that a third of top featured games never reply at all. That dataset is hard to recreate because it depends on review volume, sentiment, ratings, and developer-response data at scale.
The product connection is equally clear. AppFollow helps teams manage app reputation; the benchmark shows why that work matters. Review response behavior affects ratings, ratings affect discoverability, and reputation becomes a measurable growth lever.
The Evidence
At the page level, the benchmark report is almost invisible. The URL shows zero organic keywords, zero organic traffic, zero backlinks, and zero AI responses across AI Overviews, ChatGPT, Gemini, Perplexity, Copilot, and Grok. Judged only by report-page performance, the asset would look weak.

The findings perform better than the page. A search for “gaming app reputation benchmarks” pulls AppFollow’s data directly into Google’s AI Overview

That is a meaningful discoverability signal, but it needs a careful reading. The source panel is mostly AppFollow-linked material: AppFollow posts, employee posts, LinkedIn posts, republished copies, or sources carrying the company’s own benchmark content. Google can find the data, but the visible evidence does not show a strong independent citation layer around it.

The exclusion search reinforces the same pattern. Searching the benchmark name and the “51.5 million reviews” figure without AppFollow’s domain returns LinkedIn, Reddit, Scribd, Downdetector, S&P Global Market Intelligence, and app-adjacent results. The dataset is memorable, but much of the visible pickup still appears close to AppFollow’s distribution orbit rather than independent publications repeatedly using the report as default evidence.

That makes AppFollow the clearest contrast in the scorecard. The proprietary data is strong, the findings are commercially powerful, and Google can surface the research in category search. But the report page has no organic or backlink footprint, and the visible amplification is still heavily tied to AppFollow-linked sources. AppFollow has strong evidence; the market has not yet turned that evidence into a repeated reference asset.
AppFollow Score Breakdown — 15/25
Originality: 5/5 — The benchmark draws on 51.5M reviews, 22,800 gaming apps, and more than 561,000 developer replies. The dataset is difficult to replicate.
Reference Value: 2/5 — The findings appear in search results and adjacent sources, but much of the visible pickup is AppFollow-linked, employee-led, republished, or close to AppFollow’s own distribution orbit. There is limited evidence of independent publications repeatedly using the report as source material.
Discoverability: 3/5 — AppFollow’s findings surface in category search, including Google’s AI Overview, but the benchmark URL itself has zero organic keywords, zero traffic, zero backlinks, and zero AI responses. The data is discoverable; the report page is not.
Distribution: 1/5 — Most visible distribution appears owned, employee-led, or republished. There is not enough unaffiliated market carry to score this higher.
Commercial Usefulness: 4/5 — The findings connect clearly to AppFollow’s product: review response behavior affects ratings, ratings affect discoverability, and reputation management becomes a growth lever. The product logic is strong, but the report could make the path from insight to product action more explicit.
Total: 15/25
Tip for You
If your research has one or two findings with strong commercial value, do not leave them buried inside the full report. Turn each major finding into its distribution asset:
A standalone SEO page for the finding
A simple chart people can screenshot or cite
A short explainer that states the insight and why it matters
A sales slide that connects the finding to buyer pain
A LinkedIn-native post written around the tension in the data
A newsletter pitch or media angle built around the most surprising stat
What Answer Engines Remembered About Each Company
Beyond Ahrefs and Google, I ran a broad answer-engine recall test to understand which research publishers surfaced when the category was queried without naming any of the five companies in this study.
The prompt was:
“Which companies publish the most useful original research, benchmarks, or reports for understanding current trends in PR/media relations, consumer insights, customer messaging/lifecycle marketing, app reputation/review management, and talent acquisition? Please recommend credible sources and explain what each company is known for.”
I tested this across ChatGPT, Gemini, Perplexity, and Claude on 29 June 2026. I treated the results as directional rather than definitive because answer-engine outputs can vary by model, retrieval context, phrasing, and timing.
Still, the test was useful for one specific question: when asked broadly about credible research sources across these categories, which companies were recalled without being named?

Muck Rack had the clearest recall. Across the models, it appeared as a source for PR benchmarks, journalist research, media-relations trends, AI in PR, and pitching behavior. More importantly, some answers recalled named Muck Rack research assets, not only the company name.
AppFollow also surfaced, but the signal needed more caution. Some outputs referenced the substance of its benchmarks: reply rates, rating lift from developer responses, automation adoption, and category-specific review norms. That is stronger than a plain brand mention because the models were recalling the shape of the research. Still, this did not outweigh the weaker evidence from search and distribution, where much of the visible pickup remained AppFollow-linked. In the scorecard, AppFollow’s answer-engine recall helped its discoverability score, but did not justify a higher reference or distribution score.
Ashby was weaker in this specific test. Its Talent Trends work has strong evidence in third-party citations and LinkedIn use, but broad talent acquisition prompts tended to retrieve LinkedIn, Greenhouse, Indeed Hiring Lab, SHRM, Korn Ferry, HR.com, Josh Bersin Company, and Gartner HR instead. That suggests Ashby has credibility among talent professionals, but weaker broad answer-engine recall than older or more frequently cited talent research sources.
Customer.io appeared in customer messaging and lifecycle marketing contexts, but the recall was more mixed. In some outputs, it appeared as the primary lifecycle messaging source; in others, the category was owned by larger or more frequently cited companies such as HubSpot, Salesforce, Braze, and Iterable. That fits the company’s broader profile: Customer.io has credible research and commercial relevance, but its State of Messaging work has not yet become the default research piece for lifecycle marketing.
Attest surfaced in some consumer insights outputs, especially as a marketer-friendly source for consumer pulse research, but broad consumer insights recall was crowded by larger institutions. GWI, Kantar, Ipsos, YouGov, NielsenIQ, Forrester, Gartner, Statista, and McKinsey appeared more often as default sources. That shows how much harder broad recall is in a category with entrenched research brands.
The useful takeaway is, citation, search visibility, and answer-engine recall do not always move together. A company can be cited by practitioners and still fail to surface in a broad LLM answer if the category is crowded with older institutions. Category specificity also matters: AppFollow had more room to stand out in app reputation than Attest had in consumer insights or Ashby had in talent acquisition.
For the scorecard, I treated this as one input into Discoverability, alongside organic search and report-level visibility. It did not determine the score on its own.
What the Teardown Revealed About B2B Research
1. The strongest research gave buyers evidence for an argument they needed to make
The highest-scoring assets worked because they reduced the buyer’s burden of proof.
Muck Rack helps PR and comms teams explain why pitching needs to become more precise, why journalist preferences matter, and why media relations cannot be managed on intuition alone. Ashby helps talent leaders quantify hiring pressure: more applications, heavier interview loads, stretched recruiter capacity, and offer risk.
That is the test B2B teams should apply before publishing research: will this help the buyer make a clearer case to the person who controls budget, strategy or approval?
2. Proprietary data still needs market carry
Attest earned citations, but broad consumer insights discovery is still dominated by larger research and consulting brands. Customer.io had credible material and a clear product connection, but its State of Messaging Report has not become a default source for lifecycle messaging benchmarks. AppFollow had one of the strongest datasets in the study, yet most visible amplification stayed close to AppFollow-linked sources.
The issue in these cases is use-case clarity. The market needs to know when to cite the research, what argument it supports, and which business problem it helps explain.
Without that, even good data stays trapped inside the report.
3. Research performance is a portfolio of signals
Research influence did not show up in one place.
Traffic showed whether an asset captured demand. Citations showed whether third parties treated the research as source material. Social posts showed whether people could use the findings without the brand pushing them. Commercial usefulness showed whether the research made the product's value easier to explain. And answer-engine recall showed whether a model would name the company when someone asked about the category without naming it first.
That means a serious research program cannot stop at launch metrics. It needs a post-launch measurement system that tracks how the research is reused, cited, discovered, and recalled across search and LLMs.
4. AI recall rewards accumulated category authority
The answer-engine test showed that recall is shaped by category infrastructure, not only by the quality of a single research asset. Muck Rack surfaced because its research is tied to a clear PR and journalism use case. AppFollow had more room to appear because app reputation has fewer dedicated benchmark sources. Attest, Ashby and Customer.io faced categories where models defaulted to older institutions with more citations, listicles, analyst coverage, reviews and search authority.
That lines up with Ayomide Joseph’s AI search experiment, published by Gaetano DiNardi, which found that AI search tends to recommend brands inside the category’s consensus pool. This implies a report needs to earn third-party mentions, category association, and repeated use before it can become something answer engines recall.
The Real Test: Can the Market Use It?
B2B research earns its keep when it gives the market something useful to carry.
A report can drive traffic and still leave no trace in the category. It can also have modest traffic and become the source buyers, sales teams, consultants, journalists, and answer engines use to explain a problem.
So the better question is not only “Did this report perform?” It is: did the research create evidence worth repeating?
That is the difference between publishing a report and becoming part of how the market understands the problem your product exists to solve.


amazing piece man....